DevOps / SRE Homelab (Multi-Node)
VirtualBox • Ubuntu Server • Docker • Prometheus • Grafana
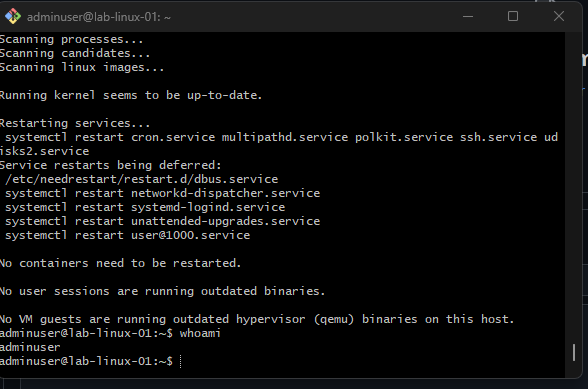
Built a 3-node homelab to simulate production-style SRE workflows: Linux administration,
containerized services, and monitoring dashboards.
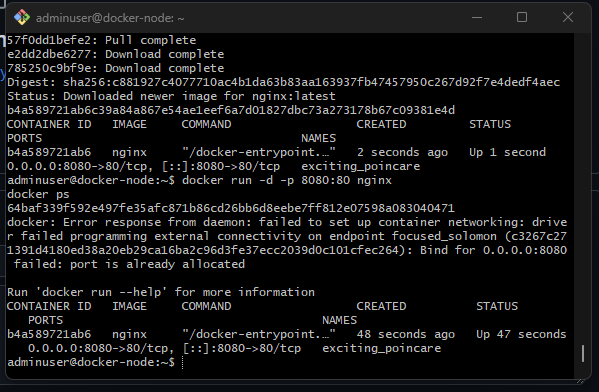
- infra-node, docker-node, monitor-node with NAT port-forwarded SSH
- Nginx container deployed and validated with port mapping
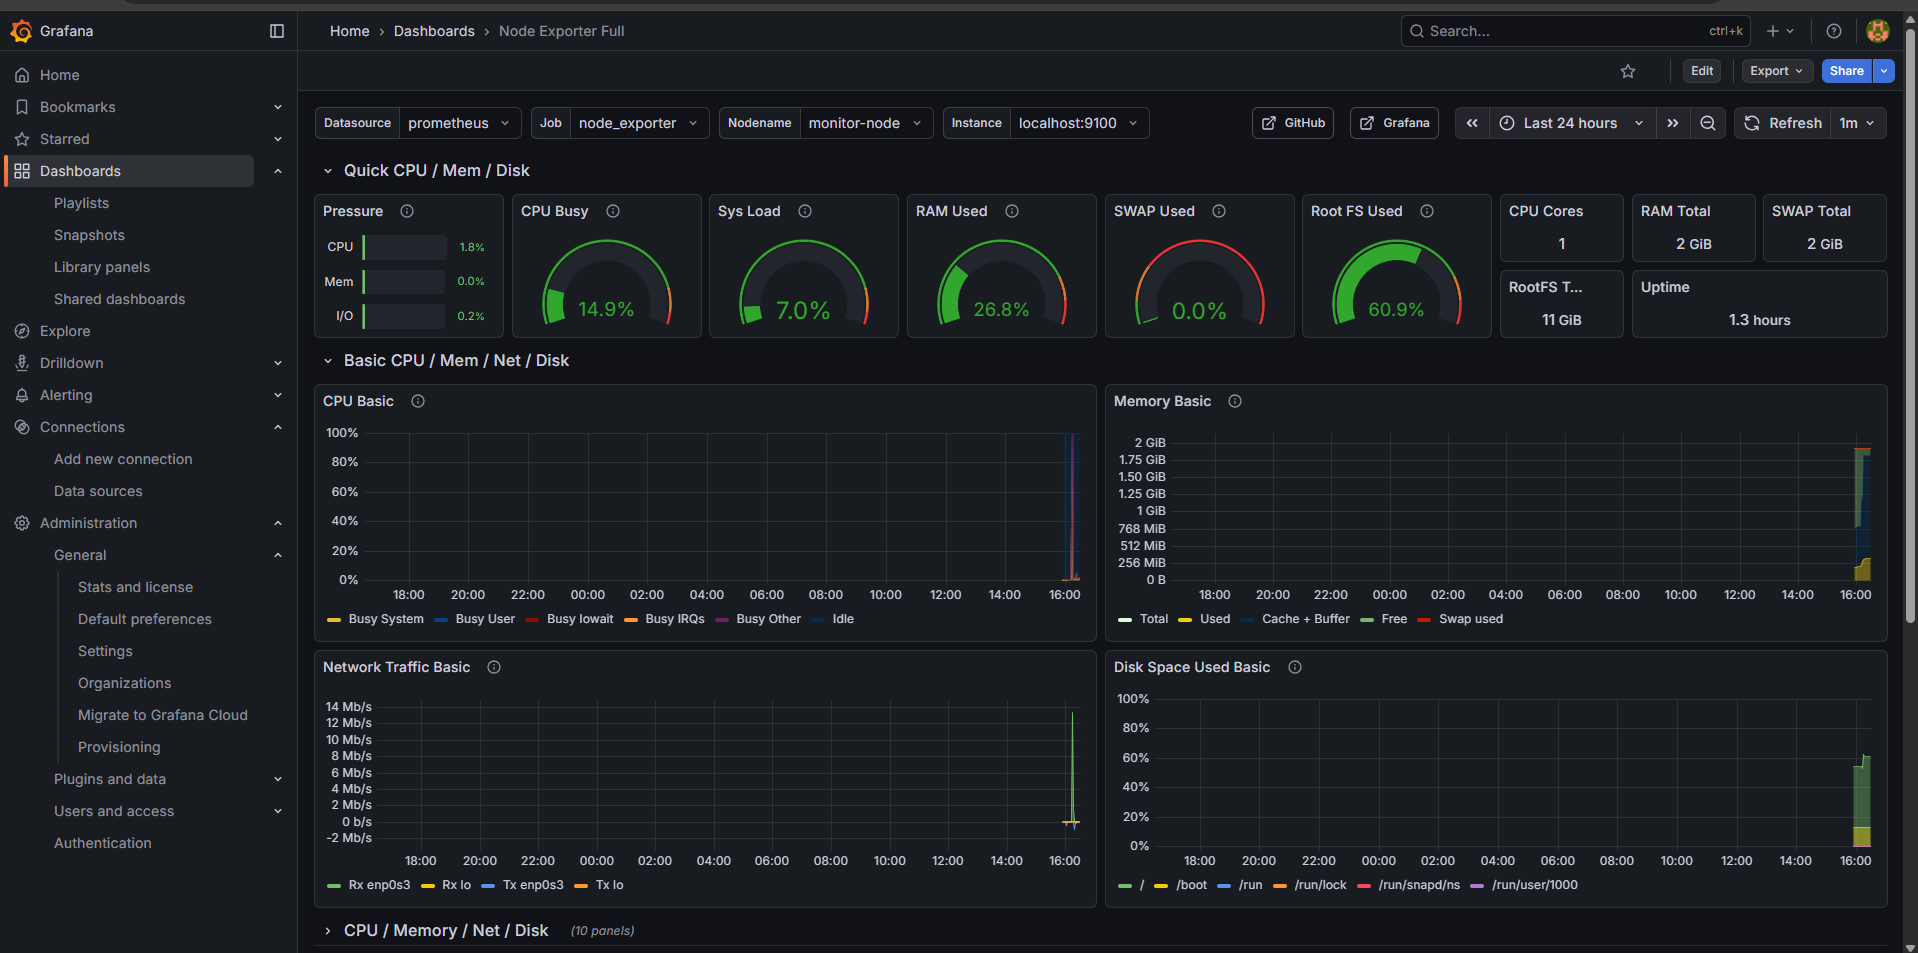
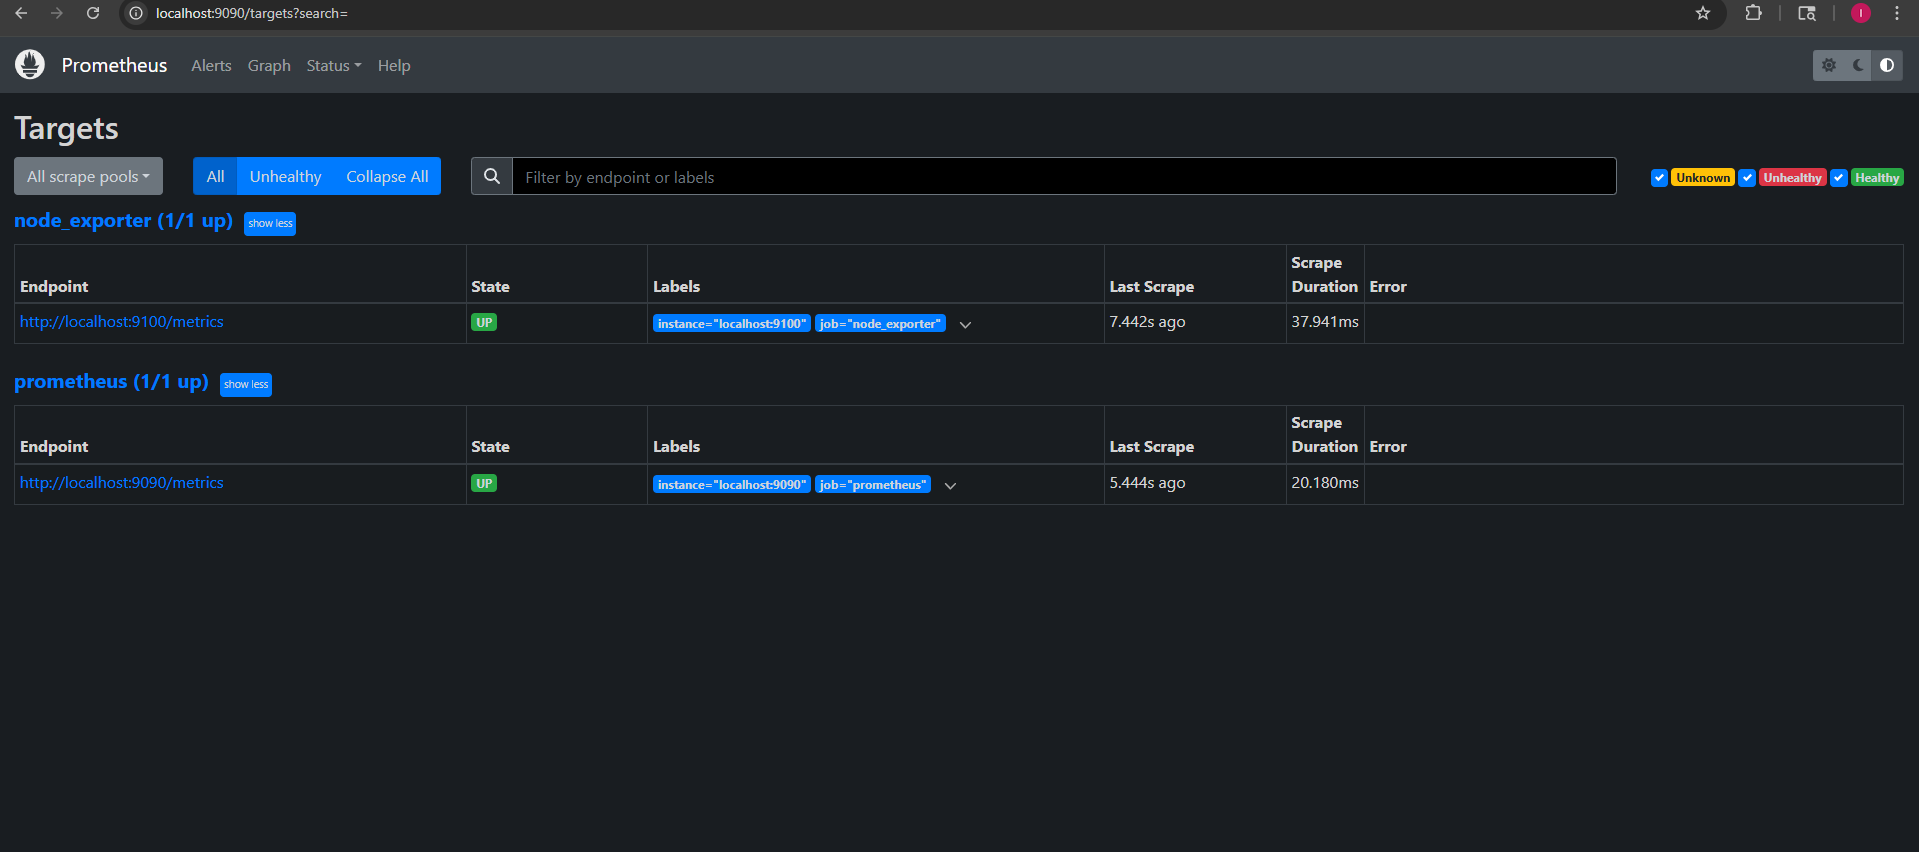
- Prometheus + Node Exporter targets visualized in Grafana
Monitoring Stack Lab
Prometheus + Grafana + Alertmanager (VM / Docker)
Built an end-to-end observability stack with dashboards and alerts to detect CPU, memory,
disk, and service-health issues before users notice.
- Dashboards: node exporter, app metrics, latency
- Alerts: disk > 80%, service down, high error rate
- Runbooks: step-by-step response playbooks
Log Pipeline (ELK)
Filebeat → Logstash → Elasticsearch → Kibana
Centralized system and application logs, added parsing rules, and built Kibana dashboards
for faster debugging and incident triage.
- Structured fields for HTTP status, response time, host
- Kibana views for error spikes and top failing endpoints
- Retention + index lifecycle strategy (basic)
CI/CD Pipeline
GitHub Actions → Docker build → Deploy
Automated build/test/deploy for a small web service. Reduced manual steps, ensured repeatable
releases, and added basic checks.
- Build + test on PRs
- Docker image publish on merge
- Deploy to VM with rollback notes
Terraform AWS VPC
VPC + subnets + routing + security groups
Infrastructure-as-code example showing a clean, modular Terraform setup with variables,
outputs, remote state notes, and reusable modules.
- Public/private subnets + route tables
- Security group patterns (least privilege)
- README with “how to apply safely”